Interactive data visualization and storytelling
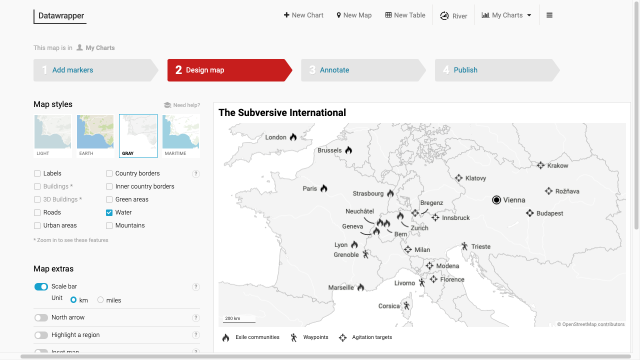
Create static charts, maps and tables for print
Send us your favourite tools and collections to info@tempopedia.org and we will add them to the directory.
Made with by Sebastian Majstorovic. This work is licensed under a Creative Commons Attribution 4.0 International License .
 .
.